Empower your employees with automation
Grow your business
with AgilityTM

Are your warehouse operations disrupting your business?
Manual processes are costing your business every day. Lost time and lost inventory are lost money. You’re aware there’s a problem, but it’s overwhelming to change. Yet you must change for your business to thrive. It’s time to stop struggling with:
- Data Errors
- Loss of inventory
- Inaccurate audit counts
- Delayed shipments
- Unhappy customers
- Frustrated employees
Transform your warehouse operations with automation.
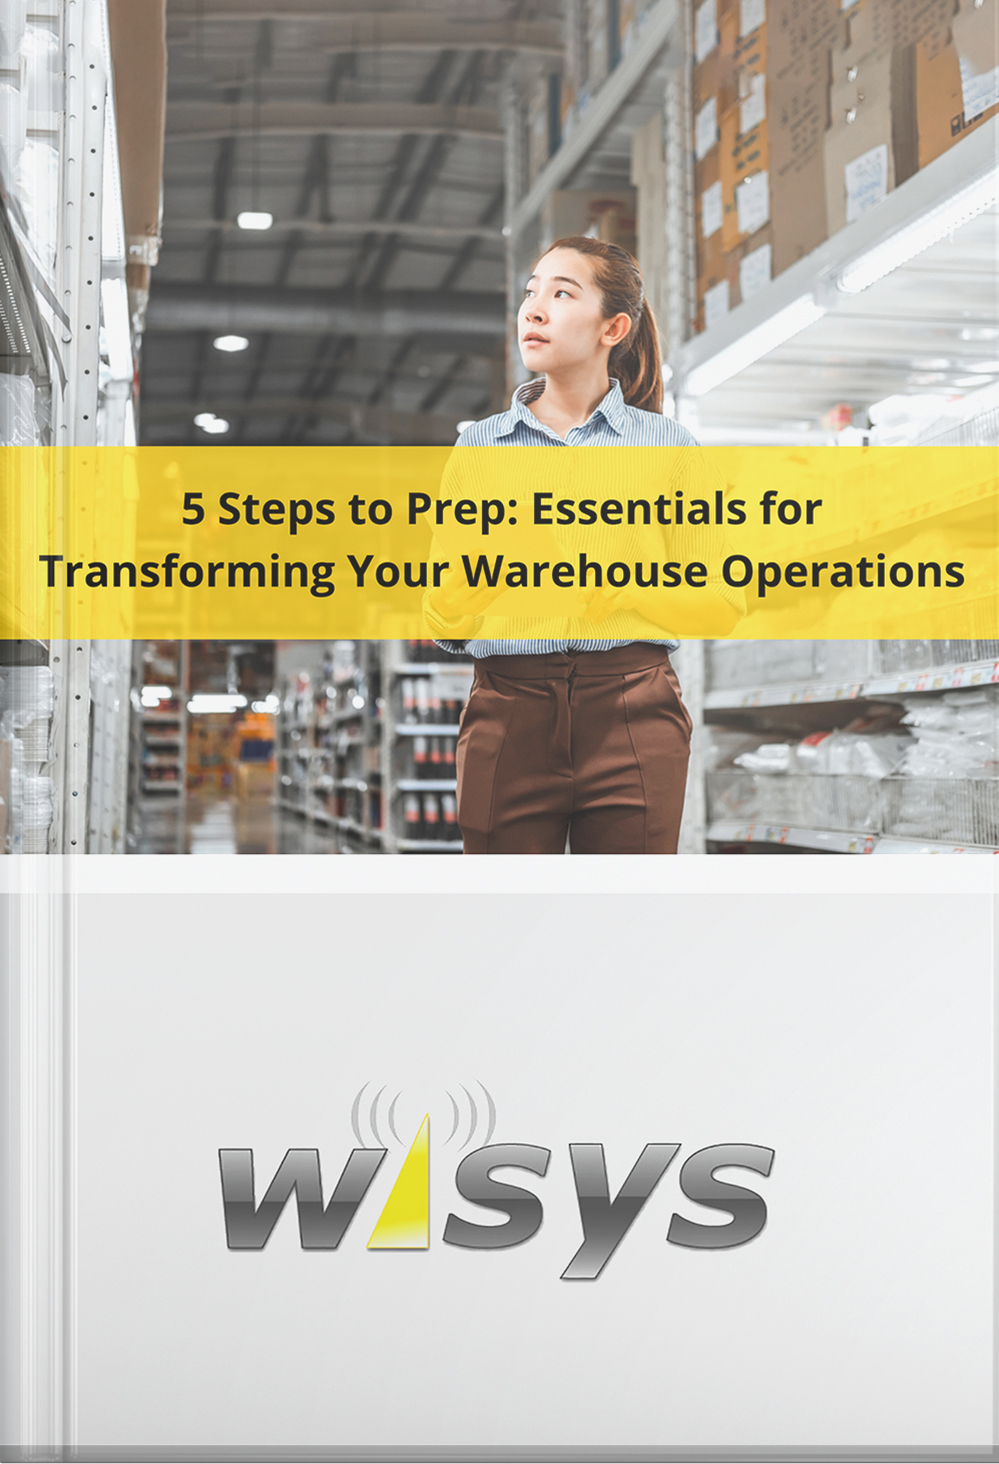
Warehouse management is complex, and many companies (even successful ones) can struggle. While you’re considering implementing a WMS or switching solutions, you can get a head start on the process. Here are five steps you and your team can take now to prepare for implementing a warehouse management system.
WMS Software for SAP Business One and Macola
Change shouldn’t be so hard. At WiSys, we understand that there is never a “right” time to transform your business. It’s why we’ve built Agility, a warehouse management system for SAP Business One and Macola that makes warehouse management easier. Now you can stop wasting time and money and instead empower your employees to grow your business.
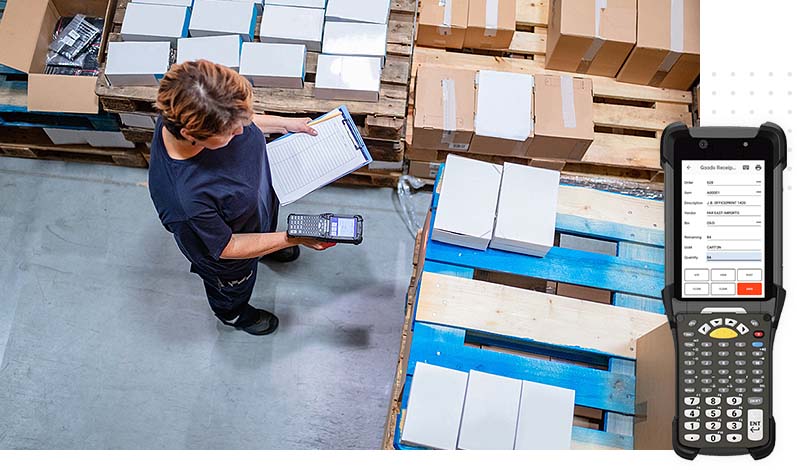
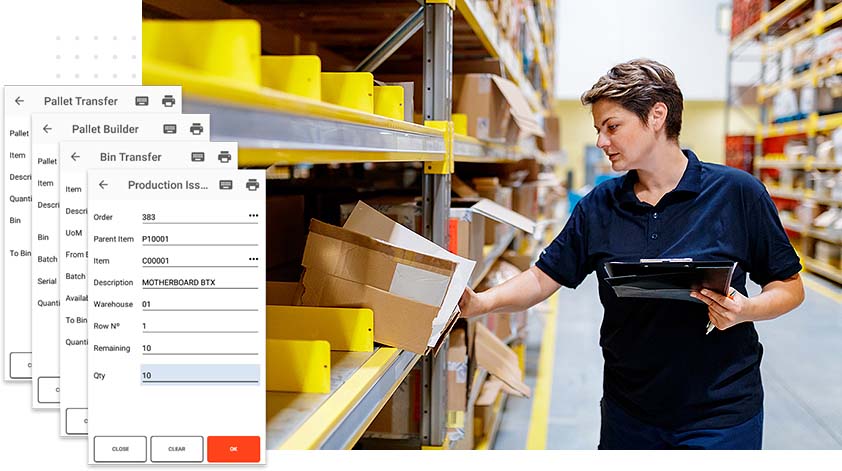
Revolutionize your receiving.
Agility puts your inventory into your ERP at first touch. Make receiving your single source of truth, in every step from goods receipt to put away to production issue.
Transform your tracking.
Agility records and tracks all inventory transactions. Have real-time traceability of what, when and where from bin to pallet to warehouse.
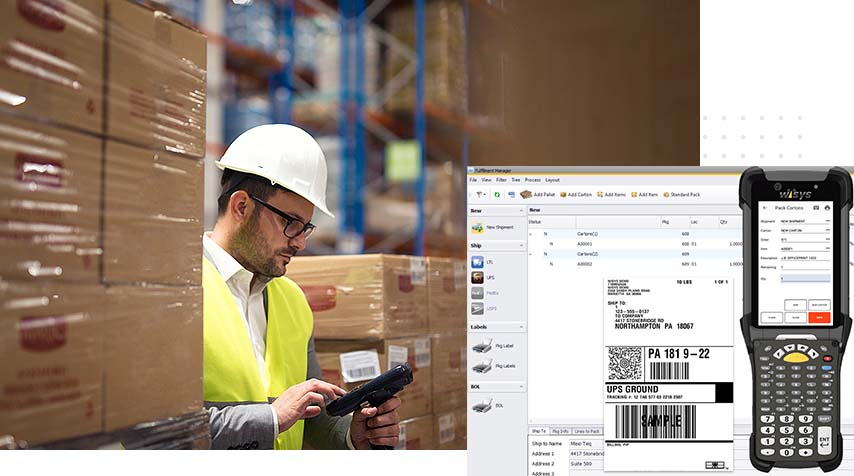
Streamline your shipping.
Agility integrates your shipping with parcel carrier partners such as UPS, FedEx, and USPS. Get finished goods out the door accurately faster from picking to packing to delivery.
Warehouse Management made easy.
Stop wasting time and money waiting for the right moment to automate your warehouse operations. We can help you get started. Here’s how we do it.

Step One
We collaborate with you to adapt our solution to your unique business needs.

Step Two
We help you build out a complete warehouse management system empowered by your ERP.

Step Three
We provide training and support to empower your team’s performance with warehouse automation.
See how others easily transformed with Agility.
Food and Beverage, Chemical Manufacturing, and Discrete Manufacturing.
Faber-Castell USA
“Moving into real-time WMS changed things so much and made our processes so much faster, easier and reliable. We use WiSys for
everything.”
Brendan McGee, IT Manager
Nine Line Apparel
“Our team members got the training needed to use the tools effectively, which allowed them to grow and develop as employees that were invaluable to the company.”
Jordan Nearhoof, Director of Fulfillment
Ram Products
“The fact that WiSys is a business partner, not just a software developer, has been the biggest impact. They have really helped us think through our processes and make those efficient for us.”
James Shotts, VP of Operations
Ask your ERP partner about WiSys.
At WiSys, we understand transforming your warehouse operations can be risky and overwhelming. But it doesn’t have to be—and even more, it’s an imperative to grow your business.
That’s why we’ve built a warehouse management solution to make transformation faster, easier, and less disruptive, so you can stop wasting time and money and instead take your business to the next level.
We have assembled the finest team to collaborate with you to design, build, train and support your sophisticated needs. Together, the team has decades of experience helping thousands of businesses leverage their investment in their ERP software.